Exponential Trendline and LOGEST
The Exponential Trendline fits data to the expression
y = B ´ exp(Ax) (1)
The LOGEST function fits data to the expression
y = B ´ Mx (2)
How can we get the trendline values into a worksheet cell?
Comparing expression (1) and (2) we see that:
Mx = exp(Ax) (3)
Taking natural logarithms of both sides of (4) gives:
xLn(M) = Ax (4)
From which we see: A = Ln(M) (5)
Hence, the natural logarithm of the first term (M) obtained from the LOGEST function equates to the A term in the Trendline expression
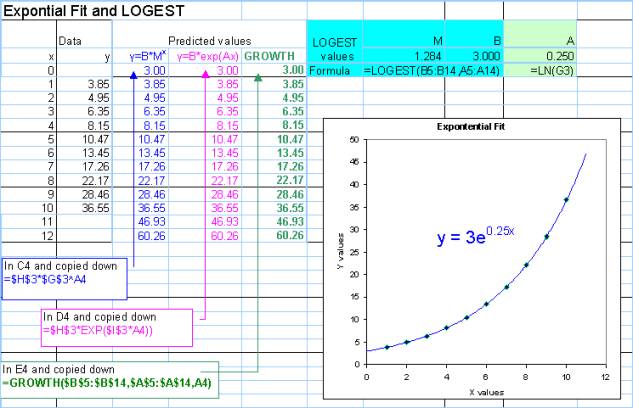
In the attached worksheet the data (A5:B14) was used to make the XY chart. An exponential trendline was added to the chart giving the expression y = 3 ´ exp(0.25x).
The range G3:H3 was selected and the formula =LOGEST(B5:B14, A5:A14) was entered and completed with SHIFT+CTRL+ENTER since it is an array function. We see that this gave M = 1.284 and B = 3.00. In I3 the formula =LN(G3) gives the result 0.25 as the value of A. This is in agreement with our expression (5) above.
There are a number of ways of obtaining the predicted y-values. These are shown in column C, D and E.
Alternatively, one may use LINEST to obtain the A and B values in cells – see smaller diagram.

November 2005