Regression Analysis using Matrix
Algebra
(General Linear Model)

You have n pairs of (x,y) data; your task is to fit this data to the
equation.
![]()
We do this by finding the values of the coefficients b1, b2, …, bk that give the minimum sum of the squares of the residuals between the given and the computed y-values (i.e. the least-squares fit).
Assuming your worksheet has had the x- and y-values entered, the next step is to construct the X matrix which, for n pairs of (x, y) values and k coefficients will of size n by k. The elements of the matrix will be as shown in the table below. If the first term in the equation for y is the intercept then f1(x) will be unity (the number 1) so this will be the value in each element of the first column.
|
f1(x1) |
f2(x1) |
f3(x1) |
… |
fk(x1) |
|
f1(x2) |
f2(x2) |
f3(x2) |
… |
fk(x2) |
|
… |
… |
… |
… |
… |
|
f1(xn) |
f2(xn) |
f3(xn) |
… |
fk(xn) |
In the figure below we see an example of fitting 6 data points to a quadratic equation (3 coefficients).
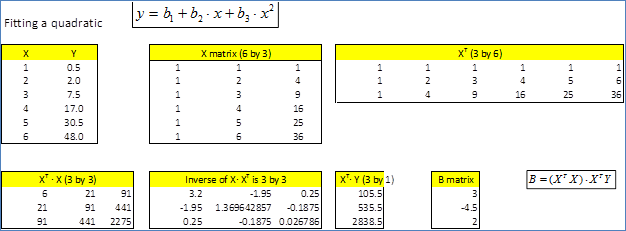
This documents is not the place to offer a proof but it can be shown that one can generate a matrix (here called B) of the coefficients using the formula B = (XTX)-1·XTY.
In the top part of figure above we have the (x,y) pairs, the X matrix as just described and its transpose XT. The column of y-values constitutes the Y matrix. In the lower part we first compute XTX and then the inverse (XTX)-1. We next compute XTY and finally we get B from B = (XTX)-1·XTY.
The file NonLinearFit.xlsx contains three examples: fitting a linear equation y = b1 + b2·x, fitting a quadrat equation y = b1 + b2·x+b3·x², and a log10(P)= b1 + b2·(1/T) + b3·log10(T) + b4·T². The latter reveals the true value of this method: Solver is unable to get even a reasonable fit.