Membrane Transport
Cells are the functional unit of life; they must be able to communicate with their environment and with each other. In Lab Six, we modeled membrane transport to give you a better understanding of the movement of solutes and water across membranes.
The pooled data are shown below. Thank you to the Thursday morning lab section from 2008 and the Tuesday afternoon section 2009 for taking the time to enter their data.
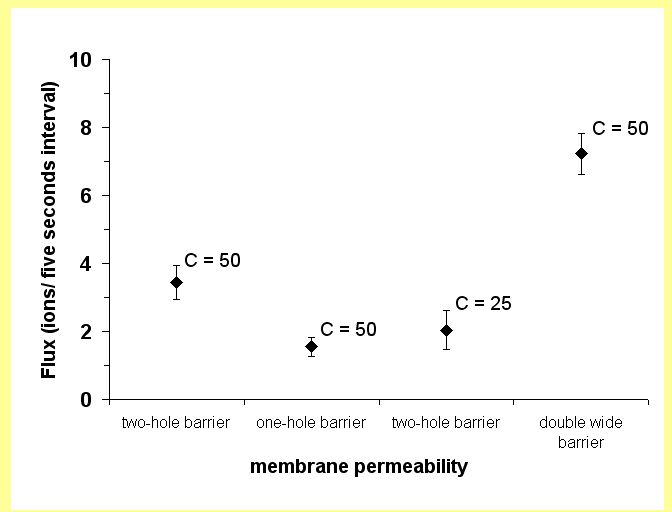
Figure 1. Diffusion exercises (one and two) from lab six. Average flux over five second intervals for different membrane permeabilities (x-axis) and solute concentrations (C, number of marbles). Error bars are the 95% confidence limits; N=100 for each test. Which tests show significantly different fluxes from each other?
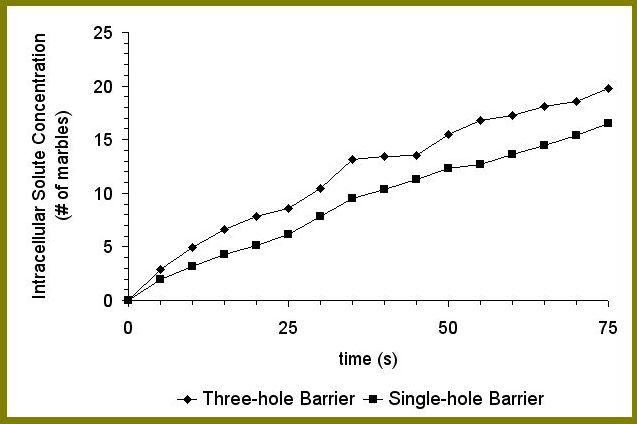
Figure 2. Exercise 3.3 and 3.4. Fifty solutes (marbles) were in the extracellular environment, with none intracellularly at t = 0. Has equilibrium been reached in either case? Each point represents the average of ten or twelve trials.
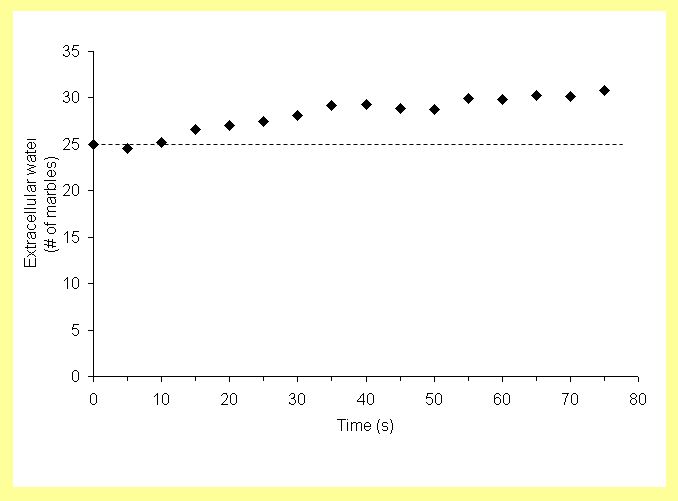
Figure 3. Exercise 4, Osmosis. Water molecules (marbles) have moved from an area of low solute (caps) concentration to an area of high solute concentration. Each point represents the average of ten trials. Was equilibrium reached?
![]()
Figure 4. Exercise 5. Active transport results in an increased intracellular potassium concentration. Each point represents the average of nine trials. Was equilibrium reached?
 |
Department of Biology St. Francis Xavier University Antigonish, NS Canada B2G 2W5 |