Biology 304
Cardiac Muscle Lab
Here are two
series of temperature data. What are the Q10 values between each
pair? The chart speed was 0.1 cm/s.
You must look at both of these images: 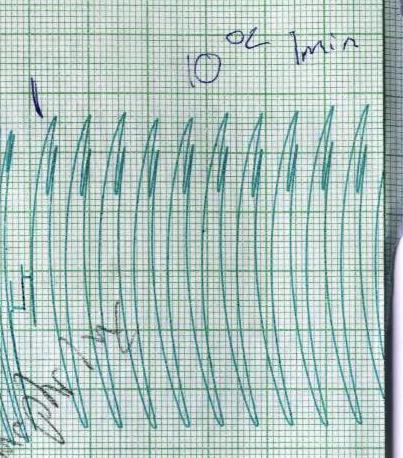
![]()
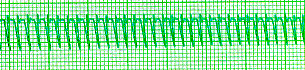
This is
another set of data, with answers. These are not to be used in a report.
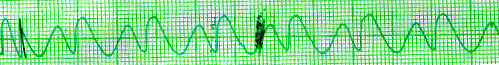 10 °C
10 °C
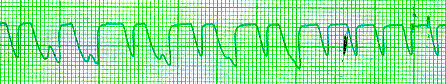 15 °C
15 °C
 Note that the
expression 10/T1-T2 is the exponent to V1/V2,
not just of V1.
Note that the
expression 10/T1-T2 is the exponent to V1/V2,
not just of V1.
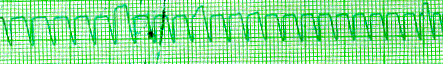 20 °C
20 °C
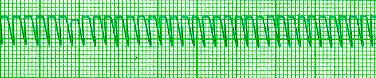 25 °C
25 °C
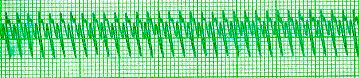 30
°C
30
°C
 35 °C
35 °C
You
actually don’t need the chart speed to calculate the Q10s from any
pair of tracings above. You do have to know that the chart speed was the same
in all the trials.
·
What does a Q10 of 2 mean?
·
What does a Q10 of 0.5
mean?
Thanks to
all who contributed their data!
|
R.F. Lauff Department
of Biology |