|
Click on the thumbnails to see the graph. Be able to explain these graphs. |
||
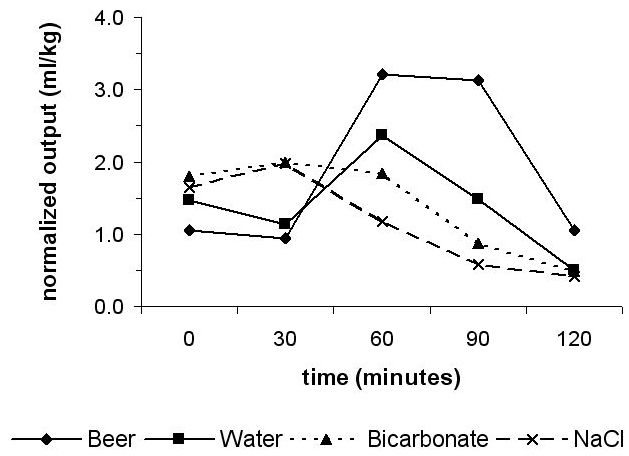
| Normalized Output Volume | The changes from T0 to T30 are all insignificant. |
 |
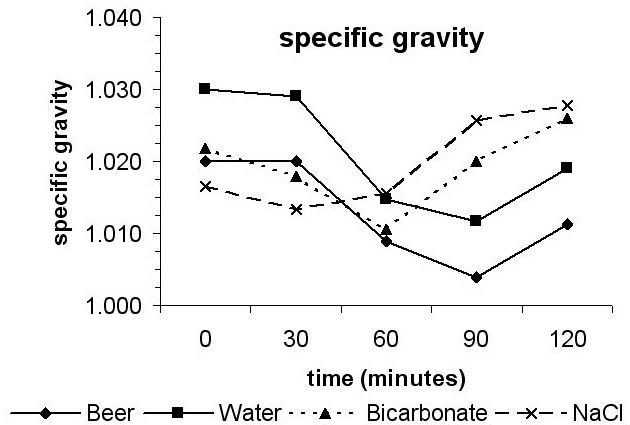
| Specific Gravity | It is unclear what causes the drop at T60 for bicarbonate drinkers. Ignore this. |
 |
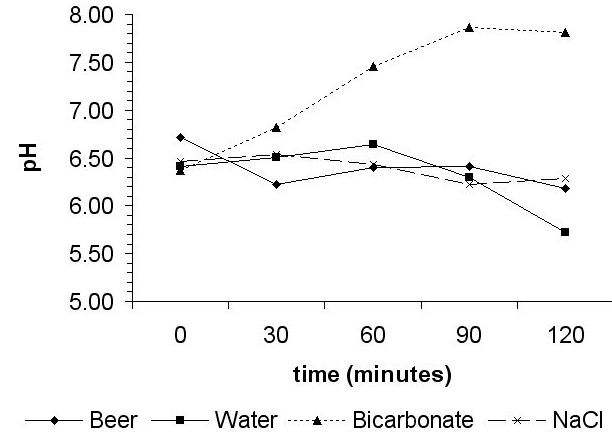
| pH | Only the bicarbonate drinkers show a significant change. Sometimes, NaCl drinkers do, too - what would the change be, and what would cause it? |
 |
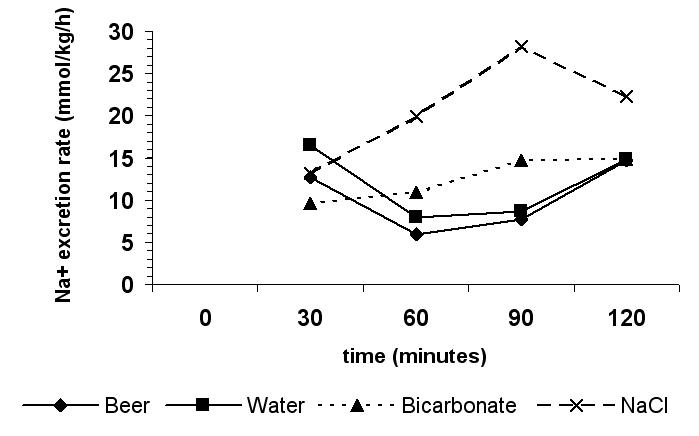
| Sodium Output Excretion Rate | The terminal values for the water and beer drinkers seem high; picture them as not different from the T90 values. |
 |
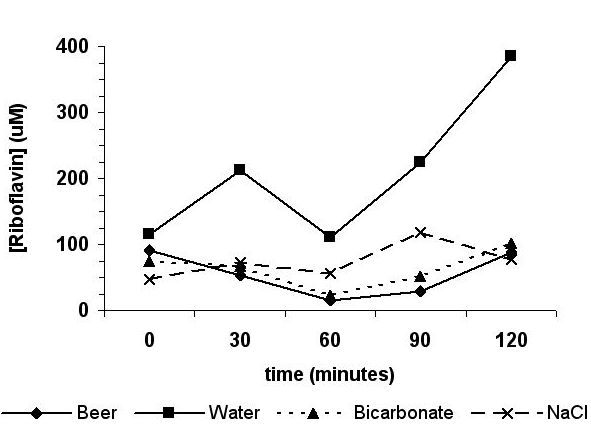
| Riboflavin concentration in the urine | It is unclear what causes the transient peak at T30
for the water drinkers (remember that there was a day's worth of
riboflavin mixed into the water). Ignore that peak. Although the riboflavin concentration didn't change much in the urine of the other volunteers, how would you find out if the absolute amount of riboflavin changed? |
 |
Thanks to all who contributed their data!
The Bowman's Capsule image is courtesy of The Biodidac Project.
|
St. Francis Xavier University
|
|