Remember, there's a difference between oxygen consumption and metabolic rate. Mass-specific oxygen consumption is one index of metabolic rate (what is metabolic rate?). What are other indices of metabolic rate? Refer to the following figures in your text for pertinent results and the accompanying discussion for explanations: 5.8, 5.9 and 5.10.
 |
|
The graph illustrates the oxygen consumption for a number of
endotherms under basal conditions. Where on this graph would you plot a 1
kg snake under basal conditions? Where would you plot this same
snake if it was slithering away from a 4 kg fox that was chasing it?
Where would you plot the fox? Please note that both axes are
logarithmically-scaled. Just so we're clear...the graph is the whole thing shown above; it is made up of axes (including numbers and labels), one curve, and grid lines (which I normally don't like). |
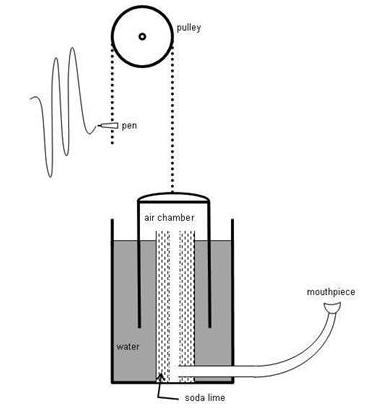
Apparatus
 |
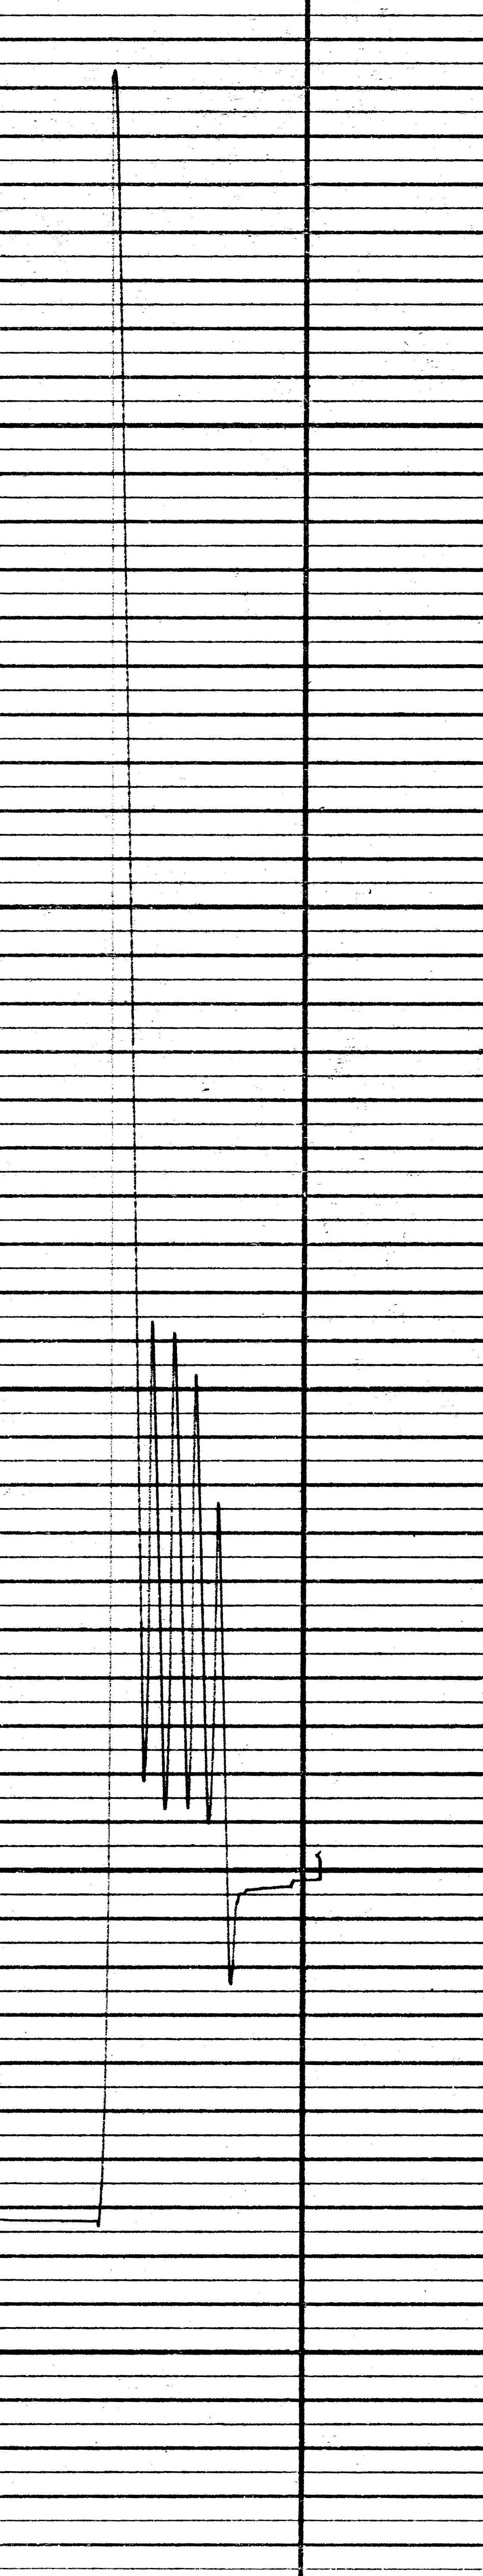 |
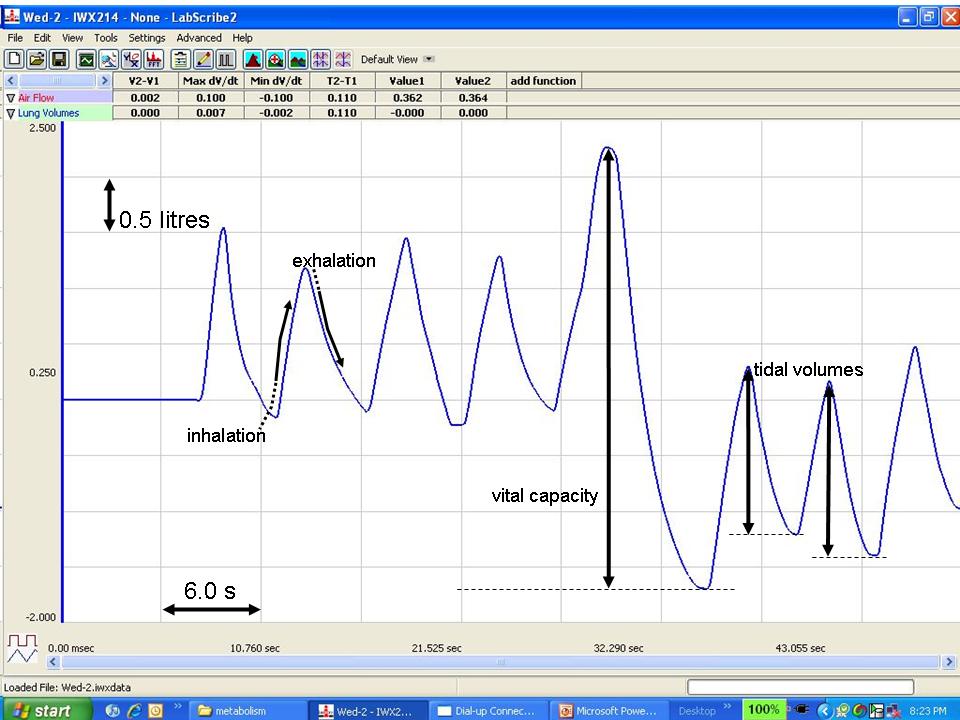
Figure 1. The spirometre which can be used to measure CO2 evolution; the tracing on the right uses the modified protocol we used in lab starting in 2012; from that tracing, you should be able to measure Tidal Volume, Vital Capacity, Expiratory Reserve Volume, and Inspiratory Reserve Volume. The volume between the closest-spaced horizontal lines is 50 ml. Between the darkest horizontal lines is one litre. Stuck? See the digital tracings, below. What is the mathematical relationship between these four subdivisions of the lung?
 |
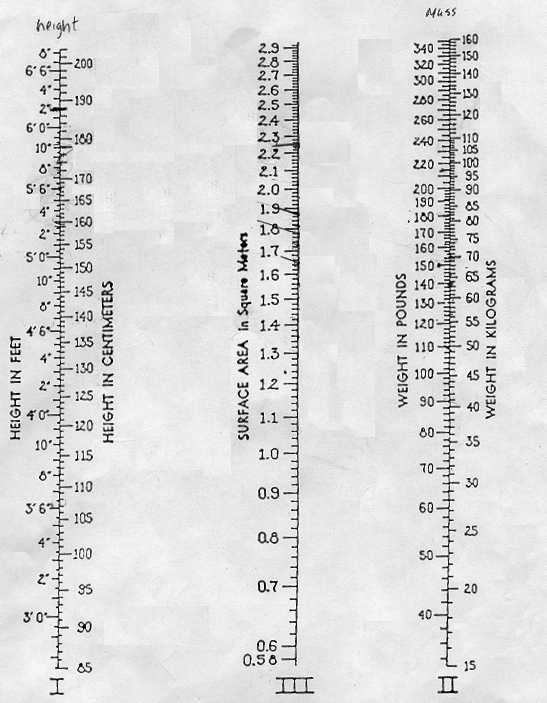 Body Surface Area |
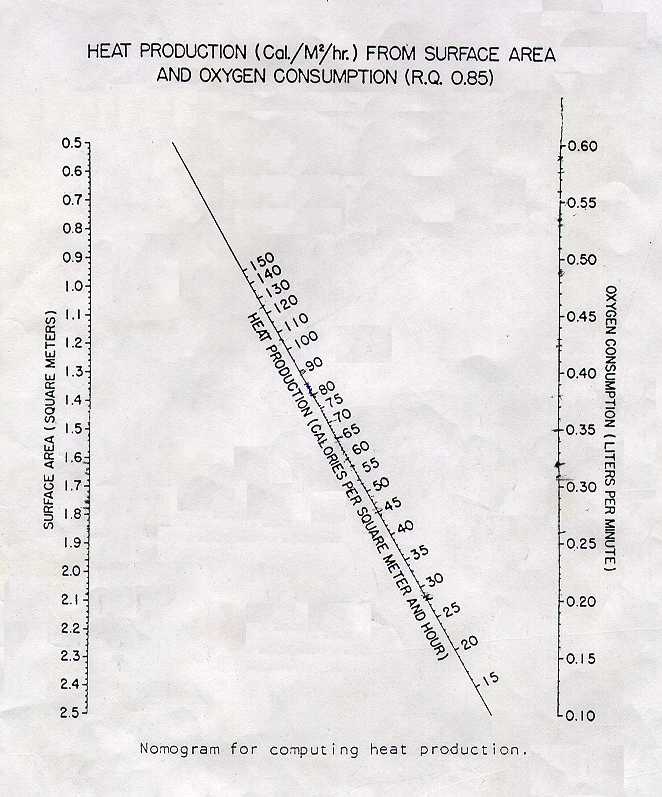 Heat Production |
|||
| Figure 2. A spirometre tracing for an hypothetical 15 year old boy that stands 105 cm tall and weighs 60 kg. | |||||
|
Figure 3. A spirometre tracing of a 51.5 kg, 20 year old lady who stands 172 cm tall. |
Percent Difference
|
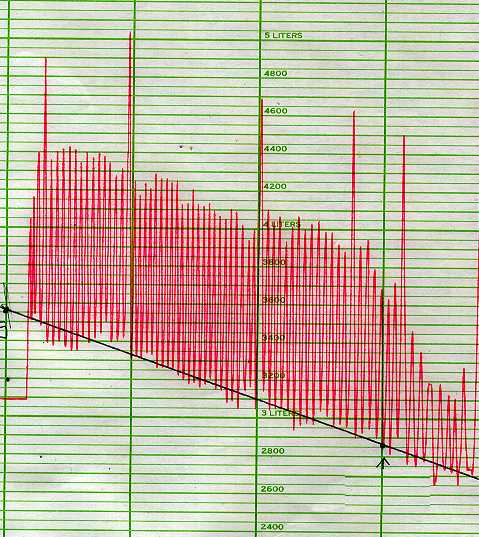
The BTPS factor is 1.080, nomograms are available by clicking on their thumbnails. | |||
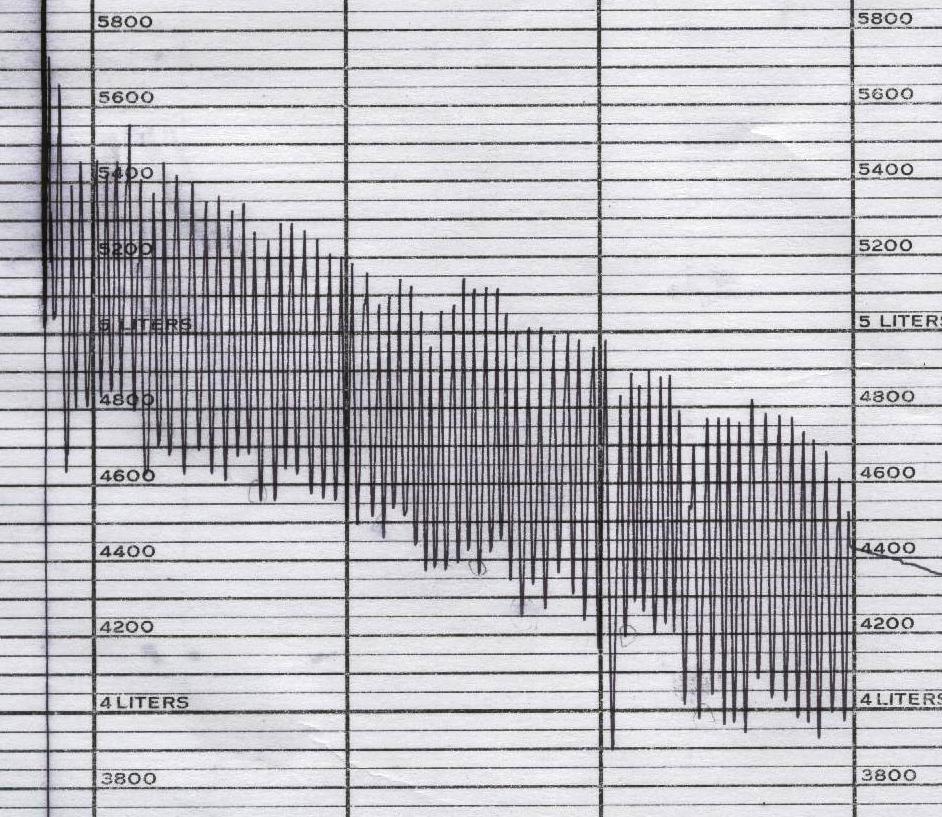
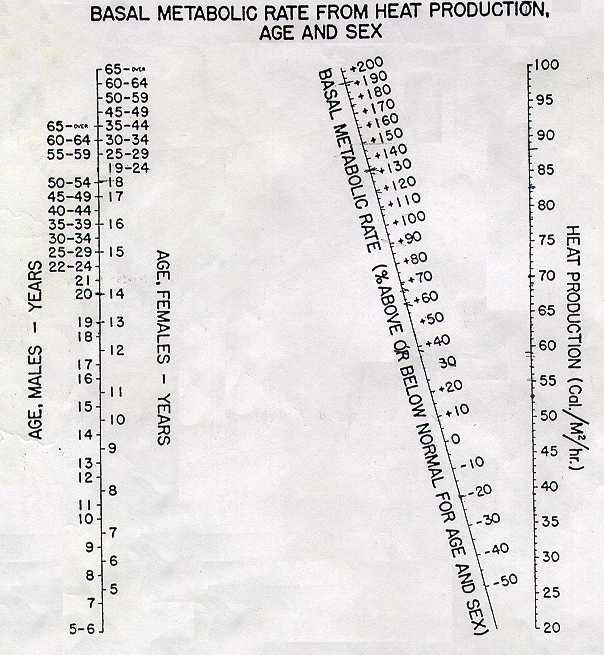
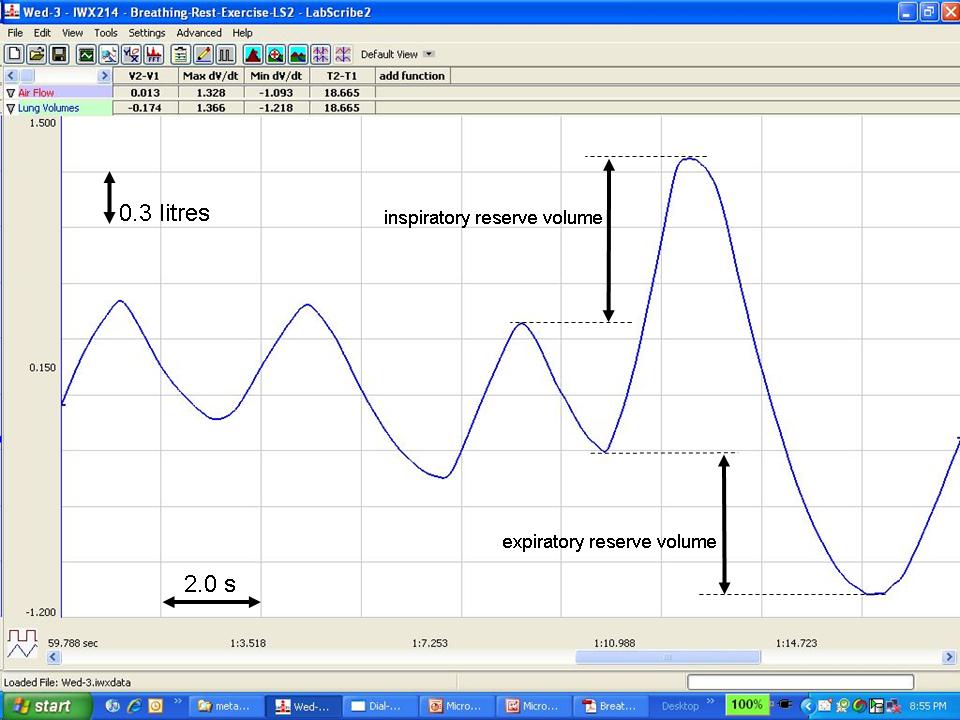
Figure 6. The digital versions of spirometry. Note that the x- and y-axis
scales are different in the two images.
Blood-glucose data are available here:
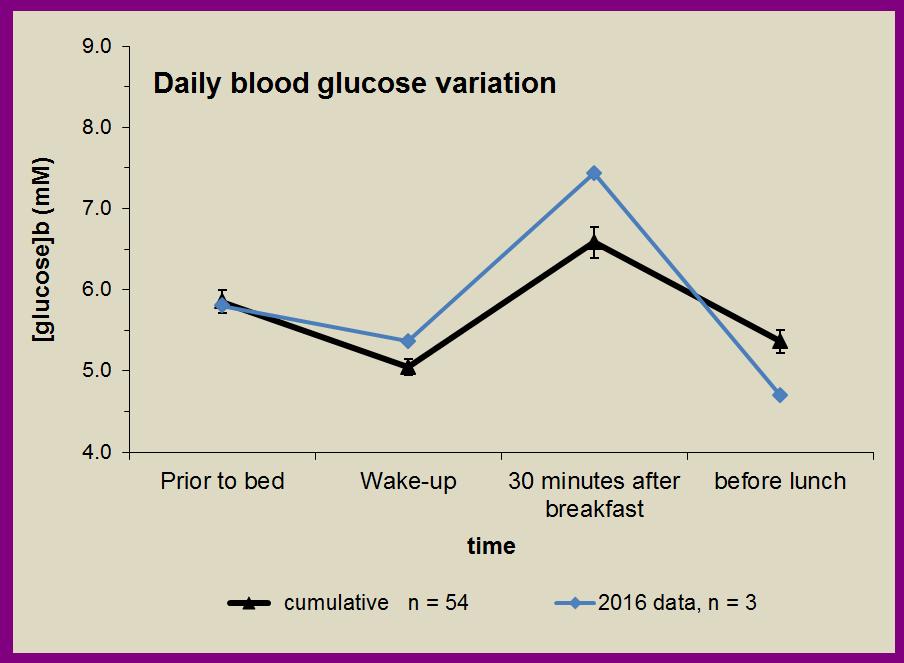
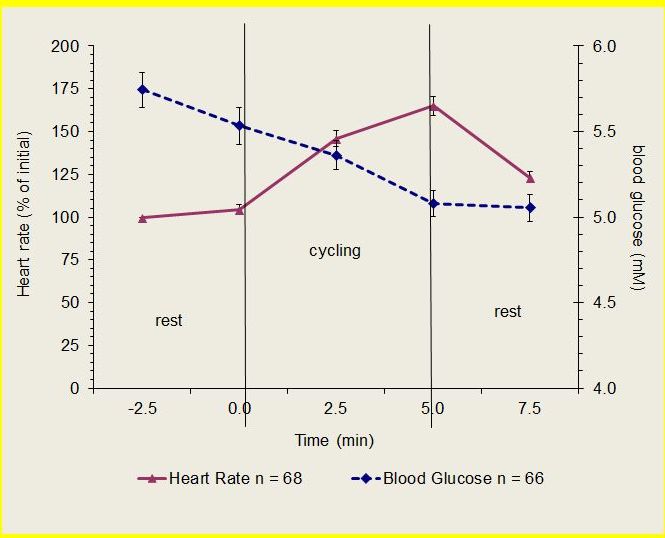
Thanks to all who contributed their data!
|
St. Francis Xavier University
|
|