![]()
![]()
![]()
STUDY AREA
The following description is adapted from Davis et al. (1999).
The St. Georges Bay Ecosystem Project study area extends from Lismore, Nova Scotia (Lat. 45° 42.5'N Long., 62° 16.4'W) northeast to Pleasant Bay, Cape Breton (Lat. 46° 49.8'N, Long. 48.00°W) and offshore to a line between these two points. This area consists of approximately 2,625 km2 of marine waters. The bay itself is roughly square in shape with estimated dimensions of 30 km by 30 km, a mean depth of 30 m and maximum depth of 40 m (Petrie and Drinkwater, 1978). The surface area is estimated at between 940 km2 (Prouse and Hargrave, 1977) and 1160.5 km2 (Harding et al., 1979; Kenchington, 1980). Freshwater input to the bay through land drainage is estimated at an annual average of 37 m3/s with a maximum of 114 m3/s (Petrie and Drinkwater, 1978). Spring tidal range for the bay is typically 1.4 m and the tides have a marked diurnal irregularity (Drinkwater, 1979).
St. Georges Bay and the coastline along the western edge of Cape Breton are part of the Magdalen Shelf and are bounded to the east by the Cape Breton Trough (Loring and Nota, 1973). Water depths within St. Georges Bay are shallow (less than 40 m) while farther up the coast, near Cheticamp and Pleasant Bay, depths are greater; extending down to 50-60 m (Figure 1). The Cape Breton Trough deepens from 18 m at the western end of the study area to 140 m at the eastern (Loring and Nota, 1973).
The surface water is cold immediately after the ice leaves the area (April-May), with typical water temperatures of 3-5°C (Davis et al., 1999). With solar heating the surface waters warm though the year to commonly reach 18-19°C and occasionally 20°C. The temperatures of deeper water (i.e., >20 m) range from lows of less than 0°C in the spring to >10°C by September/October. Swain (1993) provides bottom temperatures from between 1971 and 1992 for the offshore depths of the study area. From Lismore to approximately Inverness bottom temperatures have averaged 1-10°C with a range of 0-18°C, while from Inverness to Pleasant Bay bottom temperatures have averaged 0.5-5°C and ranged from -0.5 to 8°C. Swain (1993) also reports that for the Gulf of St. Lawrence as a whole, bottom temperatures between 40-59 m tended to be fairly warm in the 1970's and relatively cold since the mid-1980's.
Seafloor sediment composition has been reported in the St. Georges Bay area by Kranck (1971) and Loring and Nota (1973). The following description, and Figure 2, is generalized from these publications. Bottom sediments of the coast from Lismore to St. Georges Bay are mixtures of sands and gravels including pelites (material <5mm), pebbles, cobbles, blocks and boulders. The thickness of sediment varies from less than 1 m to 10-15 m thick. In general, this deposit (termed Buctouche sand and gravel in Kranck, 1971) is found in areas of strong currents, with an average maximum tidal current greater than 0.5 knots [26 cm/s]. This Buctouche sand and gravel is comprised of medium grained well sorted sand to coarse gravel with all gradations between the two. There are two facies, the first consisting of sand containing <5% gravel and the second containing >5%. In both facies the mud size component is less than 5% and the median particle size is 0.3 mm.
Within St. Georges Bay proper, the eastern, southern and western nearshore areas are basically of the same composition as that described for Lismore to St. Georges Bay (i.e., Buctouche sand and gravel). In the central area of the bay there are intrusions of finer sediments from Northumberland Strait. These sediments are largely (>30%) pelite with median particle diameters on the order of 0.01-0.02 mm. These Pugwash muds (terminology from Kranck, 1971) conform to areas of low tidal current speeds (<0.5 knots [<26 cm/s]). These sediments are composed of three facies: 1) a silty mud containing 95% silt and clay (median particle diameter 0.01 mm), 2) sandy mud containing 50-90% silt and clay (median particle diameter 0.02 mm), and 3) muddy sand containing 5-50% silt and clay (median particle diameter 0.12 mm). In addition, Kranck (1971) recognizes large areas within the bay of mixed bottom, areas that are not dominated by any particular sediment classification. The primary sources of these new fine grained sediments to St. Georges Bay are the river and shoreline erosion of the adjacent landmasses.
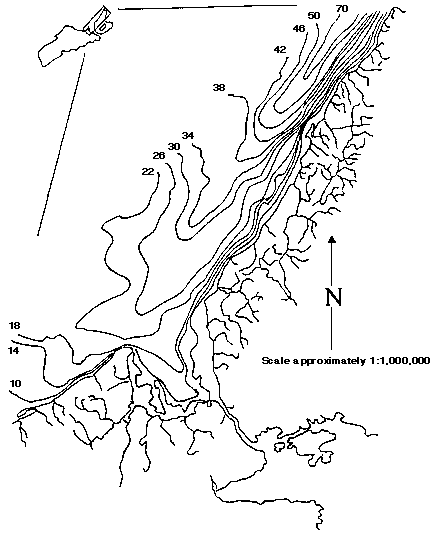
FIGURE 1: Bathymetry (fathoms) of the St. Georges Bay study area; from Loring and Nota (1973). Note: isobaths in four fathom increments except at northern end where depth increases rapidly.
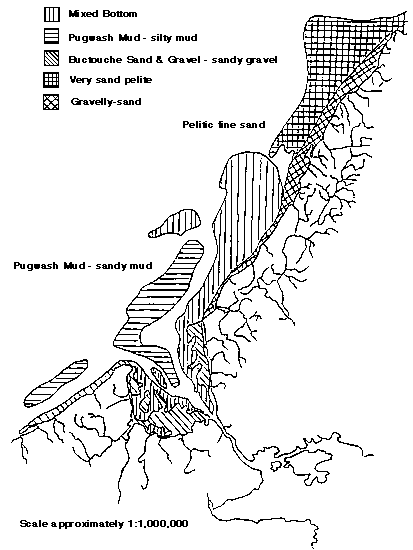
FIGURE 2: Generalized sediment distribution within St. Georges Bay study area. Compiled from Kranck (1971), and Loring and Nota (1973).
Sediment composition along the Cape Breton shores, from St. Georges Bay to Pleasant Bay, is composed of very sandy fines [pelites] along the northern edge of St. Georges Bay and Port Hood and fine sands in the offshore areas from Port Hood to Pleasant Bay. The nearshore areas within this same stretch are gravelly poorly-sorted sands (from Loring and Nota, 1973). Kranck (1971) maps the lower half of this section as mixed bottom consisting of small patches of thin discontinuous layers of mud deposited over older coarser sediment. The composition of this area varies greatly from clean well sorted gravel to poorly sorted, silty sandy gravel or fine mud.
The sources of these sediments are attributed to erosion of the local landmasses (Kranck, 1971; Prouse and Hargrave, 1977) and resuspension of deposited shallow water sediments by advective or turbulent near bottom flow (Hargrave, 1977; Prouse and Hargrave, 1977). Ice rafting of material and deposition is not thought to be an important sediment transport process within this area (Kranck, 1971; Loring and Nota, 1973), nor is the sediment ejected by the large but distant St. Lawrence River (Sundby, 1974 cited in Schafer and Mudie, 1980).