Plotting with missing
data
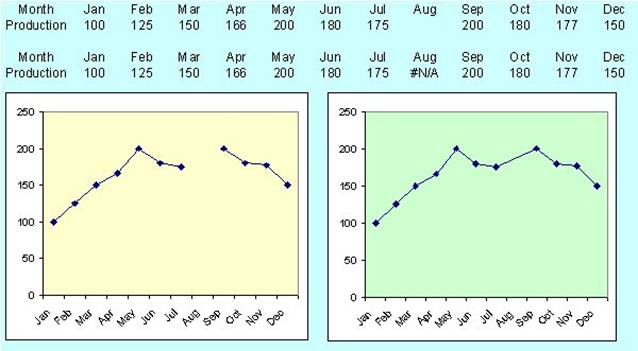
The top data gives the
chart on the left - the missing August data shows as a gap. When an empty cell
is filled with =NA(), Excel interpolates the missing data, joining adjacent data
points
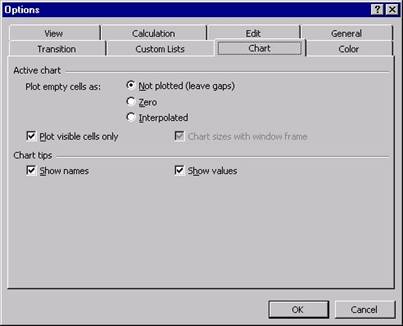
Alternatively, you may
select the chart and use Tool|Options and open the Chart tab to tell Excel how
to handle missing data – see diagram below