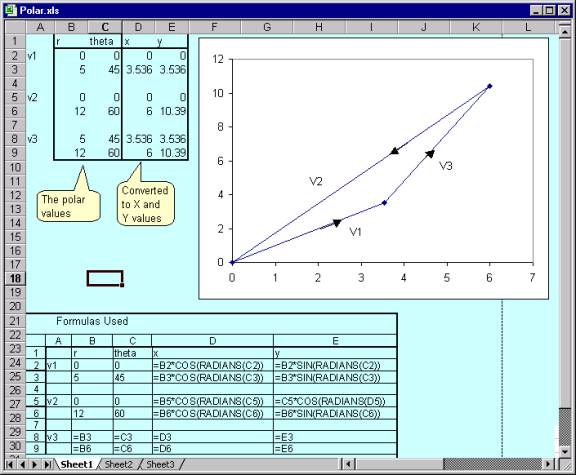
Polar Plots
(1)
Select
D2:E3 and make an XY chart
(2)
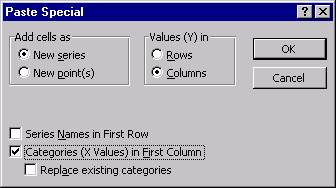
Select
D5:E6, click on the Copy tool, use the menu command Edit | Paste Special and
specify (a) New Series, (b) Values in
Columns, (c) Categories values in first column – see figure above.
(3)
Repeat
step 2 with D8:E9
(4)
Format
chart objects (data series, axis, etc) as required
Click here for sample Excel file
 Return to Excel Tips and Tricks