
Biology 304
Blood Pressure,
Electrocardiogram, Peripheral Pulse
Biology 304
Blood Pressure,
Electrocardiogram, Peripheral Pulse
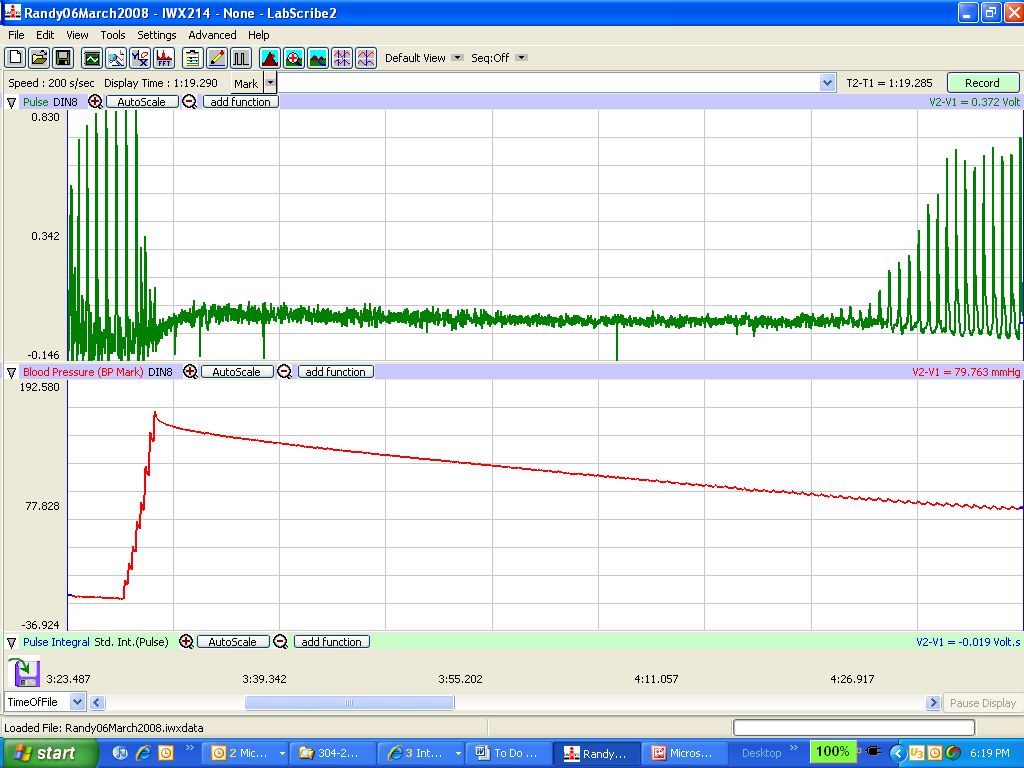 |
Figure 1. A blood pressure tracing. What is the blood pressure of
this individual? The y-axis is calibrated in 20 mmHg increments...i.e.
the value between adjacent grey horizontal lines is 20 mmHg. Don't worry if you get an odd answer...the calibration wasn't set correctly for this one. |
 |
Figure 2. A zoomed in shot of the pertinent part of the tracing in Figure 1. |
 |
Figure 3. The method of getting the blood pressure. |
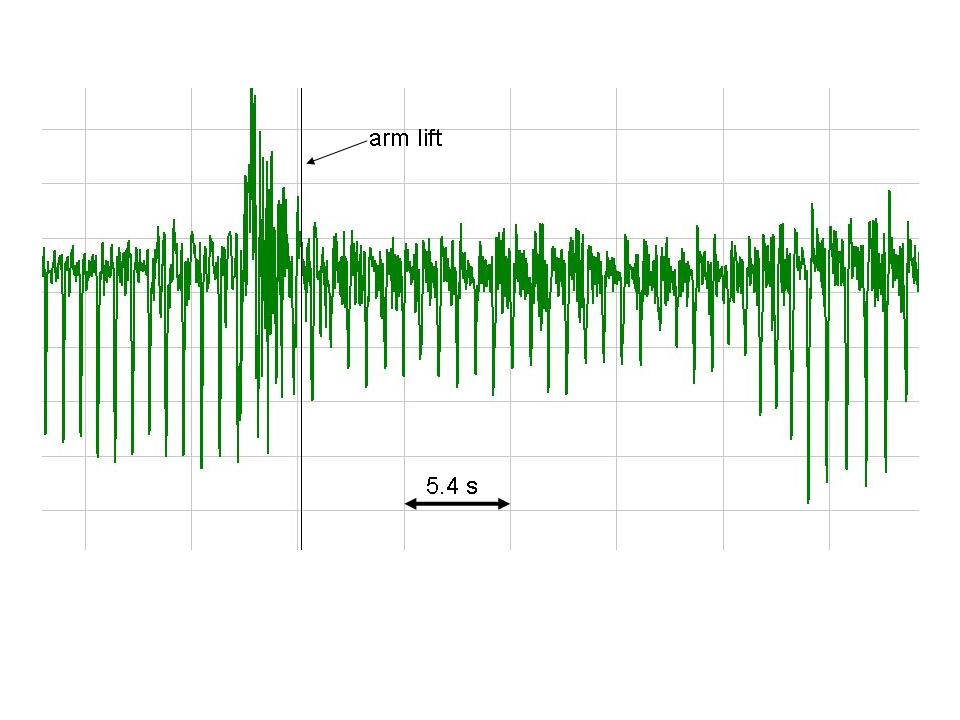 |
Figure 4. Peripheral pulse - response to gravity. |
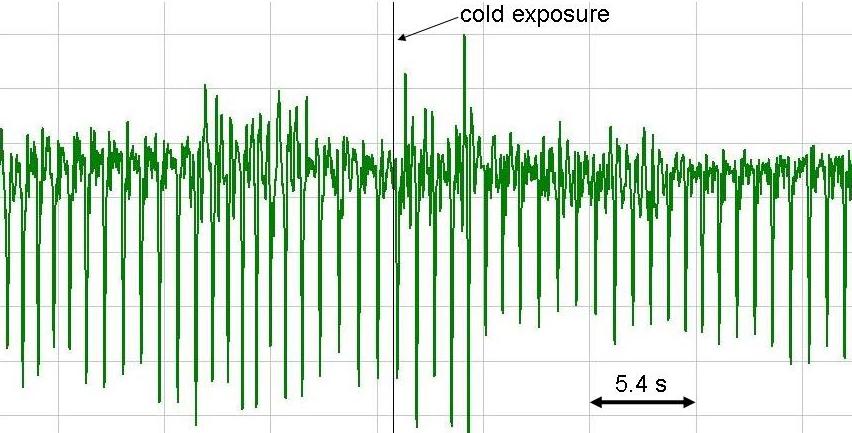 |
Figure 5. Peripheral pulse - response to cold. |
Electrocardiogram (EKG, ECG)
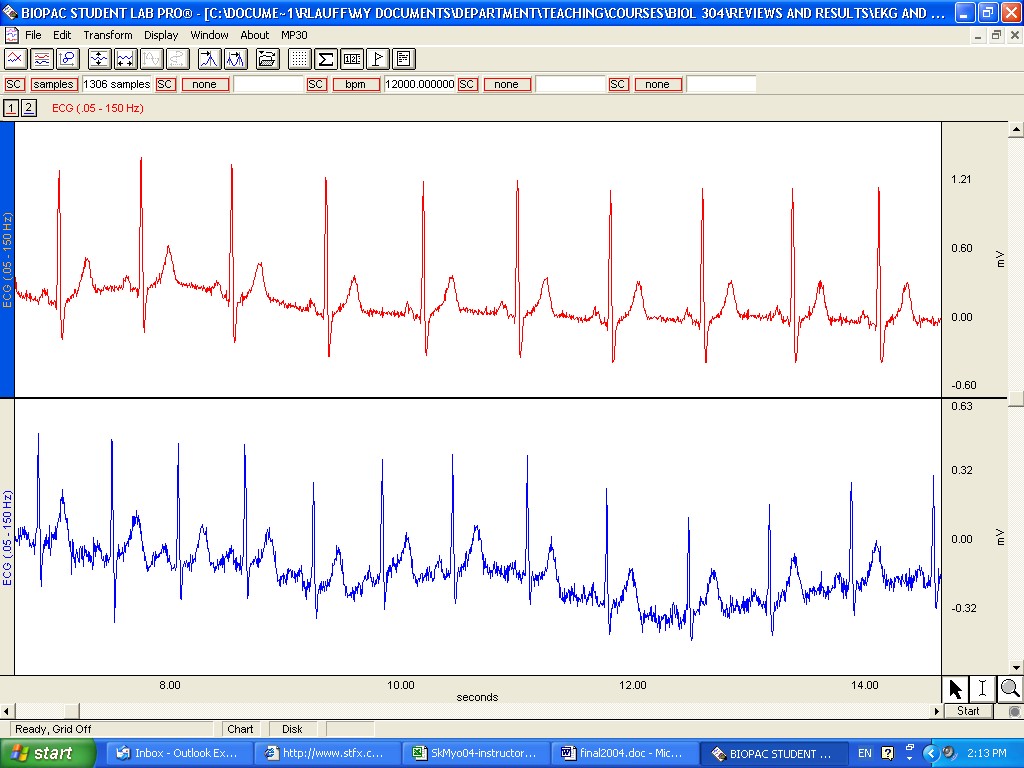 |
Electrocardiograms from two subjects. Which tracing would you consider to be from the larger subject? What two lines of evidence can you use to make your decision? |
 |
These tracings show the EKG (top) and Peripheral Pulse (bottom) prior to exercise (to the left of the dark vertical line) and after exercise (to the right of the dark vertical line). The amount of time between vertical pale grey vertical grid lines is 6.75 s; do not confuse the two medium-gray markers (Control-Exercise, post-exercise) as grid lines. By what percentage did the heart rate increase from the control period to immediately after exercise? Did the heart rate get back to normal by the end of the experiment? What accounts for the waviness in the EKG baseline after exercise? What about the one bout of waviness about 1/3 of the way into the control period? Comment on the peripheral pulse.
|
 |
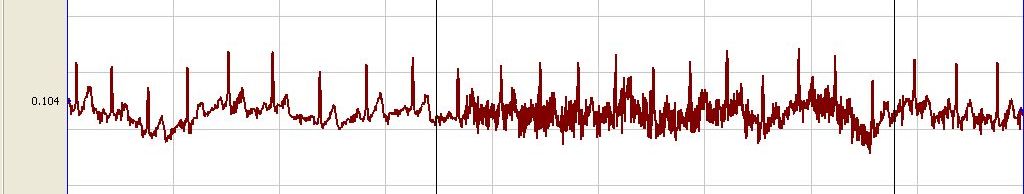
Leads I, II and III - electrocardiograms taken in lab. Explain why these leads give rise to different EKGs. |
|
|
A 12-lead electrocardiogram; why do the 12 leads look different from one another? When do paramedics/hospital staff use this instead of the 3-lead EKG? What is the progression of ailments that can be diagnosed using the 12-lead EKG, as described by Ivan Cozzi (the Paramedic)?
|
 |
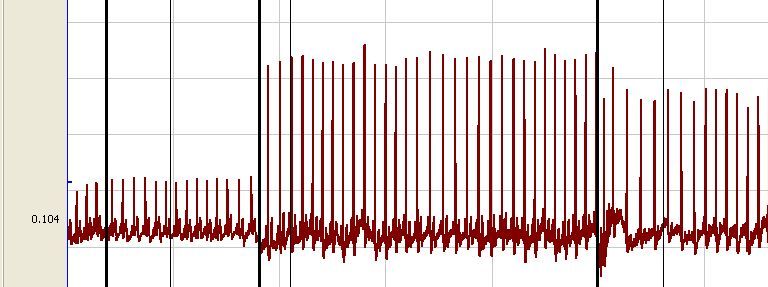
Great EKGs are being recorded until about halfway through this tracing. Explain the disturbance.
|
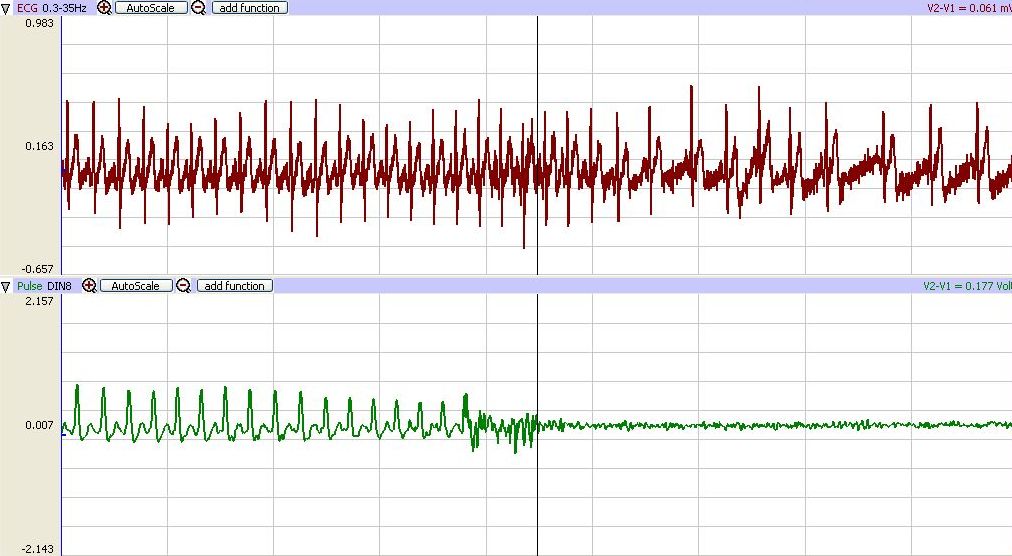 |
Upper tracing, the electrocardiogram. Lower tracing, peripheral pulse. At the marker, the subject immersed his face into a bowl of water. Describe the results (i.e. what happened)? Which cranial nerve detects sensory input in the face? Both the parasympathetic and sympathetic nervous systems are involved here - what are their roles? |
Thanks to all of the volunteers!
|
St. Francis Xavier University
|
|